

Nevada Housing Market Update for August 2021
The Nevada Housing Market Update for August 2021, presented by LasVegasRealEstate.com and published by The Lied Center for Real Estate at the UNLV Lee Business School. LasVegasRealEstate.com is pleased to offer the report summary here as well as a link to the entire report.
Nevada Housing Market Update – August 2021 – Summary of Findings
The Las Vegas and Laughlin metropolitan areas saw a large increase in single-family home prices as prices increased about 21 percent year over year. Prices increased 5.2% year over year in Mesquite, NV. All regions within the Las Vegas metropolitan area saw existing home prices increase at least 15 percent year over year. Boulder City saw the largest year-over-year increase in existing single-family home prices as prices increased 23.0 percent year over year and average prices were $556,000. Within the Las Vegas metropolitan area, Boulder City has the highest price per square foot for existing single-family homes at $282. Summerlin has the next highest price per square foot at $250. North Las Vegas has the lowest price per square foot at $202.
Average new listing prices for single-family homes were up 17 percent in the Las Vegas metropolitan area. Within the Las Vegas metropolitan area, North Las Vegas saw the largest year-over-year increase in average new listing prices as prices increased 21 percent in that region. Time on the market decreased by more than 25 percent year over year in the Las Vegas metropolitan area. Single-family home sales in Las Vegas, North Las Vegas, Henderson, and Boulder City spent an average of about 51 days on the market.
Existing condominium prices were up 20.7 percent year over year in the Las Vegas metropolitan area. Within the Las Vegas metropolitan area, Summerlin condominiums saw the most robust growth in prices as prices increased 42.8 percent year over year.
Nevada Housing Market Update – August 2021 – New Single-Family Homes and Condos
New single-family home prices saw a month-to-month increase for the fourth consecutive month. New home prices were up more than 9 percent year over year for the second consecutive month.
Price per square foot for new single-family homes saw large month-to-month and year-over-year increases. The price per square foot was up 34 percent year over year.
New condominium prices decreased on a month-to-month basis for the first time since January 2021. On a year-over-year basis, overall price and price per square foot were up over 35 percent.
Nevada Housing Market Update – August 2021 – Existing Single-Family Homes and Condos
Average existing single-family home prices increased on a month-to-month basis for the seventeenth consecutive month. Year over year price appreciation was over 20 percent for the third consecutive month.
Existing single-family home sales increased on a year-over-year basis by 17 percent. This was the fifth consecutive month where sales increased by more than 10 percent year over year.
The existing condominium price per square foot, at $215, reached its highest value since October 2008. Price per square foot was up over 22 percent year over year.
Nevada Housing Market Update – August 2021 – REO
REO sales have consistently been lower than their prerecession value over the last eighteen months. There were only 2 REO sales during August 2021. The share of single-family homes sold under distress, at 0.8 percent, continues to be lower than its prerecession value and is down more than 1.3 percentage points year over year.
Average Days on Market
Time on the market saw a month-to-month decrease for both single-family homes and condominiums. Single-family homes spent an average of 50 days on the market while condominiums spent an average of 59 days on the market.
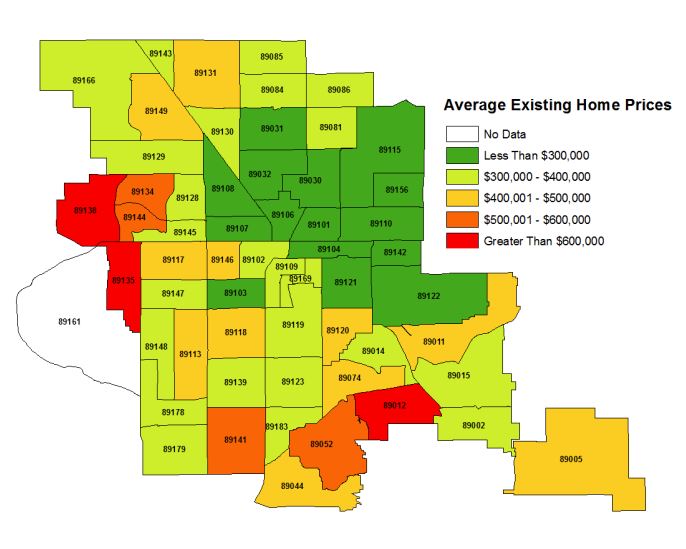
Top 5 Zip Codes in Average Existing Home Price
#1: 89135 at $976,300
#2: 89004 at $875,000
#3: 89052 at $744,700
#4: 89138 at $737,000
#5: 89012 at $679,200
Bottom 5 Zip Codes in Average Existing Home Price
#1: 89030 at $234,330
#2: 89101 at $235,770
#3: 89106 at $257,330
#4: 89115 at $267,670
#5: 89104 at $298,000
Top 5 Zip Codes in Average Existing Price Year Over Year Growth
#1: 89107 at 41%
#2: 89169 at 37%
#3: 89052 at 34%
#4: 89129 at 33%
#5: 89074 at 33%
Bottom 5 Zip Codes in Average Existing Price Year Over Year Growth
#1: 89149 at 9%
#2: 89004 at 9%
#2: 89139 at 10%
#3: 89044 at 10%
#4: 89011 at 11%
To read the entire report for August 2021, please click on the link: Lied Center for Real Estate Full Report
For more information on The Lied Center for Real Estate at UNLV please click the link: Lied Center for Real Estate
Thank you for reading our post, “Nevada Housing Market Update – August 2021.” For more Las Vegas real estate market news, information on homes for sale, information on commercial real estate for sale, or general real estate information, please visit our website www.lasvegasrealestate.com or come see us on Facebook.